Page MenuHome GnuPG

Kleopatra hangs "Loading certificate cache" on Windows 10
Open, HighPublic

Description

This is probably related to T4581 and T5760, but I didn't want to hijack those. I also tried the workaround from T5758 -- not setting a reader-port, but to no avail. The only thing that works for me is to kill Kleopatra, which in turn seems to kill the process tree and then upon a second run I often get the certificates loaded quickly. However, sometimes it takes a few tries until it works.

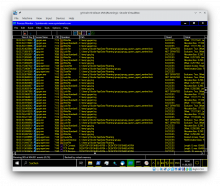
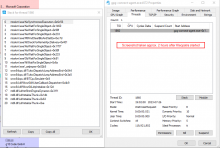
Is there a way to help out with this? I am a developer, I can attach a debugger (in fact I tried), but of course I have no matching debug symbols. Another issue was that the single thread in gpg-connect-agent.exe, the process that seems to hang, is stuck in some kernel call to a synchronization object. You can see it with Process Explorer, but with WinDbg you'd have to establish a kernel debugger connection to get behind what's going on.

I checked and it does not look like it is the loader lock, although I cannot rule it out a 100% at this point. The thread stack looks like this:

ntoskrnl.exe!KeSynchronizeExecution+0x6c56
ntoskrnl.exe!KeWaitForSingleObject+0x1460
ntoskrnl.exe!KeWaitForSingleObject+0x98f
ntoskrnl.exe!KeWaitForSingleObject+0x233
ntoskrnl.exe!RtlFindClearBitsAndSetEx+0xc7d
ntoskrnl.exe!KiCheckForKernelApcDelivery+0x401
ntoskrnl.exe!KeWaitForSingleObject+0x1787
ntoskrnl.exe!KeWaitForSingleObject+0x98f
ntoskrnl.exe!KeWaitForSingleObject+0x233
ntoskrnl.exe!ObWaitForSingleObject+0x91
ntoskrnl.exe!NtWaitForSingleObject+0x6a
ntoskrnl.exe!_setjmpex+0x82b5
wow64cpu.dll!TurboDispatchJumpAddressEnd+0x544
wow64cpu.dll!TurboDispatchJumpAddressEnd+0x3a5
wow64cpu.dll!BTCpuSimulate+0x9
wow64.dll!Wow64KiUserCallbackDispatcher+0x4b9
wow64.dll!Wow64LdrpInitialize+0x12d
ntdll.dll!LdrInitShimEngineDynamic+0x31f1
ntdll.dll!LdrInitializeThunk+0x1db
ntdll.dll!LdrInitializeThunk+0x63
ntdll.dll!LdrInitializeThunk+0xe
0x0000000000000000

The command executed shows as "C:\Program Files (x86)\GnuPG\bin\gpg-connect-agent.exe" NOP.

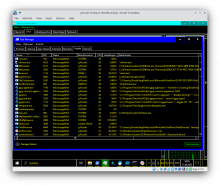
Sometimes, however, there is a gpg-agent.exe as child process of gpg-connect-agent.exe and sometimes subsequently scdaemon.exe as a child process of that.

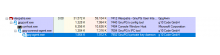
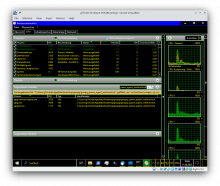
When this occurs, there are two threads inside scdaemon.exe and there are no observable context switches within one thread in "Wait:Executive" (right inside libnpth-0.dll!npth_setname_np+0x59) state and the other in Wait:UserRequest state. The latter appears to have some activity for it occasionally spends CPU cycles according to the kernel (or Process Explorer). Unfortunately I cannot tell which synchronization object could be the culprit.

I have no smartcards attached on that machine. Or lets put it this way: none I am aware of. If you have a suggestion how to list whatever GPG might consider to be a smartcard, please let me know.

It's an up-to-date Windows 10 (10.0.19045 Build 19045) inside VMware, which in turn runs on Ubuntu 20.04. However, I also have this with a bare-metal installation of Windows, e.g. on my work machine. There I do have a software protection dongle from Feitian as well as a FIDO2 key from Feitian attached. AFAIK these both work via HID (meaning without extra driver involved), though.

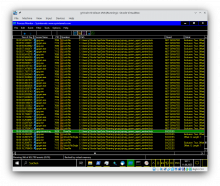
While it hangs, I can run gpg -K, gpgsm -K (also with -k, respectively). The first one returns the key lists immediately and as expected, the latter returns immediately without output. However, Kleopatra can hang for hours on end (in the first screenshot I remark on this).

$ gpg --version
gpg (GnuPG) 2.4.3
libgcrypt 1.10.2
Copyright (C) 2023 g10 Code GmbH
License GNU GPL-3.0-or-later <https://gnu.org/licenses/gpl.html>
This is free software: you are free to change and redistribute it.
There is NO WARRANTY, to the extent permitted by law.

Home: C:\Users\Oliver\AppData\Roaming\gnupg
Supported algorithms:
Pubkey: RSA, ELG, DSA, ECDH, ECDSA, EDDSA
Cipher: IDEA, 3DES, CAST5, BLOWFISH, AES, AES192, AES256, TWOFISH,
        CAMELLIA128, CAMELLIA192, CAMELLIA256
Hash: SHA1, RIPEMD160, SHA256, SHA384, SHA512, SHA224
Compression: Uncompressed, ZIP, ZLIB, BZIP2

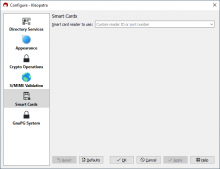
PS: Another thing I have noticed is that the setting for the smart card reader _appears_ to revert to "Default Reader" after setting it to the other one and leaving the field empty, hitting Apply. I have not yet found a reason for this behavior, could as well be a case of PEBKAC on my part.
PPS: I'll also be happy to provide a Process Monitor capture, if you think it could help. However, please point me to your public key(s), so I can encrypt it before uploading.

Details

Version
Gpg4win-4.2.0

Event Timeline

assarbad created this object in space S1 Public.

The setting which I understood to be the workaround:

aheinecke added a subscriber: aheinecke.

I also see this from time to time, mostly when the keyring is empty or very small. But never was able to reproduce it. I thought this might be fixed with keyboxd but if you say that scdaemon might be the culprit then I might misunderstood the issue and it is not the keyring loading that is stuck but maybe rather our configuration initialization which queries the config of each component and is also part of the "Loading certificate cache.."

How reliable are you to reproduce this? It would be great if we had a setup where we could reproduce this internally.

werner do you have any idea based on the information from the original report where we could start looking for this?

I also see this from time to time, mostly when the keyring is empty or very small. But never was able to reproduce it. I thought this might be fixed with keyboxd but if you say that scdaemon might be the culprit then I might misunderstood the issue and it is not the keyring loading that is stuck but maybe rather our configuration initialization which queries the config of each component and is also part of the "Loading certificate cache.."

The one machine where I took the above screenshot, has 41 public keys and 18 public/private key pairs. Does this qualify as small? Another machine where I encounter this has perhaps half of that amount, I'll check tomorrow.

How reliable are you to reproduce this? It would be great if we had a setup where we could reproduce this internally.

It happens fairly frequently, so on either of those machines I usually manage to get this soon after boot (so basically on a daily basis). But I haven't found a way to trigger this really _reliably_.

... which gives me an idea. Could it be that there is a transient dependency on some delay-started Windows service involved? To the best of my knowledge several Windows APIs rely on services under the hood -- but the relationship isn't always very visible or explicit.

I'll try to create a minimal setup with some faux private keys in a VM to which I'll be able to connect via WinDbg kernel debugging. At the very least it might give a clue which exact synchronization object it's waiting for. Right now it's totally unclear and it _appears_ not to be a loader lock issue from what I saw in user mode.

Sorry for misleading you and others, perhaps. That particular thing happens to me time and time again. So if there are no symbols the stack symbols will use an offset relative to the nearest exported symbol. So my initial jumps to a conclusion were uncalled for in regards to the meaning of the stack.

I had a closer look at the involved modules. All those listed are in fact 64-bit DLLs, because gpg-connect-agent.exe is a 32-bit process_on_ 64-bit Windows (i.e. WOW64 ... Windows on Windows 64-bit).

  • ntdll.dll!LdrInitializeThunk+0xe -> call to LdrpInitialize (internal function)
  • ntdll.dll!LdrInitializeThunk+0x63 -> call to _LdrpInitialize
  • ntdll.dll!LdrInitializeThunk+0x1db -> call to LdrpInitializeProcess
  • ntdll.dll!LdrInitShimEngineDynamic+0x31f1 -> indirect call to g_LdrpWow64LdrpInitialize (function pointer into wow64.dll)
  • wow64.dll!Wow64LdrpInitialize+0x12d -> call to RunCpuSimulation (after calls to ThreadInit, ThunkStartupContext64TO32, Wow64SetupInitialCall and before a call to ProcessInit)
  • wow64.dll!Wow64KiUserCallbackDispatcher+0x4b9 -> inside RunCpuSimulation (see this), which seems to trigger a transition to the below
  • wow64cpu.dll!BTCpuSimulate+0x9 -> call to BTCpuSimulate which calls RunSimulatedCode in an infinite loop
  • wow64cpu.dll!TurboDispatchJumpAddressEnd+0x3a5 -> call to CpupSyscallStub whose name suggests that it is about to transition to kernel mode, which we can observe from the stack trace, too
  • wow64cpu.dll!TurboDispatchJumpAddressEnd+0x544 -> actual syscall instruction, although I cannot recover which syscall that would be at this point
  • ntoskrnl.exe!_setjmpex+0x82b5 -> landing in the middle of KiSystemCall64
  • ntoskrnl.exe!NtWaitForSingleObject+0x6a -> call to ObWaitForSingleObject
  • ntoskrnl.exe!ObWaitForSingleObject+0x91 -> call to KeWaitForSingleObject
  • ntoskrnl.exe!KeWaitForSingleObject+0x233 -> call to KiCommitThreadWait
  • ntoskrnl.exe!KeWaitForSingleObject+0x98f -> call to KiSwapThread
  • ntoskrnl.exe!KeWaitForSingleObject+0x1787 -> call to KiDeliverApc
  • ntoskrnl.exe!KiCheckForKernelApcDelivery+0x401 -> call to _guard_dispatch_icall (related to CFG)
  • ntoskrnl.exe!RtlFindClearBitsAndSetEx+0xc7d -> call to KeWaitForSingleObject
  • ntoskrnl.exe!KeWaitForSingleObject+0x233 -> call to KiCommitThreadWait (had one such call above already)
  • ntoskrnl.exe!KeWaitForSingleObject+0x98f -> call to KiSwapThread
  • ntoskrnl.exe!KeWaitForSingleObject+0x1460 -> call to KiSwapContext
  • ntoskrnl.exe!KeSynchronizeExecution+0x6c56 -> call to SwapContext

So from what I gather we're seeing the first (or one of the first) thread context swap(s) for the process. Makes sense in a scenario where a thread enters a wait state. But this is still during process initialization so _unlikely to have to do anything with any code you wrote_.

From the header of gpg-connect-agent.exe I see it doesn't make use of CFG explicitly, though. Which leaves TLS as the only thing that would happen this early. I'll have to have a closer look when it happens next. Could even a defect in WOW64, it wouldn't be the first I discover. At least these are a few leads.

I don't have an idea where to start looking here.

We initialize a CriticalSection in DLL_PROCESS_ATTACH of libgpg-error. There are two versions of the library installed - a 64 bit (using a different name) and the usual 32 bit. Nothing fancy here, though.

The scdaemon process loads PC/SC using LoadLibraryEx and friends.

Libnpth.dll might be of interest; we use this to implement our user-level threading. Thus most code is run in a Critical section but for blocking system calls we leave the CS and enter it again at the end of a system call. There are a few native threads too; using explict control of the npth CS.

Sorry, I haven't been able to get any more information so far. I'll try to read up on the code a bit during my upcoming vacation, perhaps I can identify something. While I couldn't confirm that it's about the loader lock, but also couldn't rule it out.

I should be able to get back to you within 2-3 weeks. If not, feel free to close or "nudge" me via a notification.

I caught gpg-agent.exe hanging again and managed to attach WinDbg for live kernel debugging. Alas, the result is underwhelming, but I can now confirm with certainty, that the WOW64 loader lock and the fast PEB lock are not being held:

lkd> !peb
Wow64 PEB32 at 28d000
    InheritedAddressSpace:    No
    ReadImageFileExecOptions: No
    BeingDebugged:            No
    ImageBaseAddress:         0000000000400000
    NtGlobalFlag:             0
    NtGlobalFlag2:            0
    Ldr                       0000000077435d80
    ***  _PEB_LDR_DATA type was not found...
    *** unable to read Ldr table at 0000000077435d80
    SubSystemData:     0000000000000000
    ProcessHeap:       00000000008b0000
    ProcessParameters: 00000000008b2490
    ***  _CURDIR type was not found...
    WindowTitle:  '< Name not readable >'
    ImageFile:    '< Name not readable >'
    CommandLine:  '< Name not readable >'
    DllPath:      '< Name not readable >'
    Environment:  0000000000000000
       Unable to read Environment string.


Wow64 PEB at 000000000028c000
    InheritedAddressSpace:    No
    ReadImageFileExecOptions: No
    BeingDebugged:            No
    ImageBaseAddress:         0000000000400000
    NtGlobalFlag:             0
    NtGlobalFlag2:            0
    Ldr                       00007ffe969dc4c0
    Ldr.Initialized:          Yes
    Ldr.InInitializationOrderModuleList: 00000000007b3310 . 00000000007b3b60
    Ldr.InLoadOrderModuleList:           00000000007b3480 . 00000000007b3b40
    Ldr.InMemoryOrderModuleList:         00000000007b3490 . 00000000007b3b50
            Base TimeStamp                     Module
          400000 00000000 Jan 01 00:00:00 1970 C:\Program Files (x86)\GnuPG\bin\gpg-agent.exe
    7ffe96870000 5212ece5 Aug 20 04:13:25 2013 C:\WINDOWS\SYSTEM32\ntdll.dll
    7ffe960a0000 8c1a0c5b Jun 26 01:28:59 2044 C:\WINDOWS\System32\wow64.dll
    7ffe94b00000 46e2fedf Sep 08 19:58:23 2007 C:\WINDOWS\System32\wow64win.dll
        77300000 99a3a1e0 Sep 06 18:30:56 2051 C:\WINDOWS\System32\wow64cpu.dll
    SubSystemData:     0000000000000000
    ProcessHeap:       00000000007b0000
    ProcessParameters: 00000000007b29c0
    CurrentDirectory:  'C:\WINDOWS\'
    WindowTitle:  'C:\Program Files (x86)\GnuPG\bin\gpg-agent.exe'
    ImageFile:    'C:\Program Files (x86)\GnuPG\bin\gpg-agent.exe'
    CommandLine:  '"C:\Program Files (x86)\GnuPG\bin\gpg-agent.exe" --homedir C:\Users\Oliver\AppData\Roaming\gnupg --use-standard-socket --daemon'
    DllPath:      '< Name not readable >'
    Environment:  00000000007b1040
        =::=::\
        ... (trimmed for brevity)
lkd:x86> !cs 0x774333f8
SYMSRV:  BYINDEX: 0x9
         c:\symbols*http://msdl.microsoft.com/download/symbols
         ntdll.dll
         2DAA62A81a4000
SYMSRV:  PATH: c:\symbols\ntdll.dll\2DAA62A81a4000\ntdll.dll
SYMSRV:  RESULT: 0x00000000
DBGHELP: c:\symbols\ntdll.dll\2DAA62A81a4000\ntdll.dll - OK
DBGENG:  Partial symbol load found image c:\symbols\ntdll.dll\2DAA62A81a4000\ntdll.dll.
SYMSRV:  BYINDEX: 0xA
         c:\symbols*http://msdl.microsoft.com/download/symbols
         wntdll.pdb
         6771C2E71C152DBA302EC8C50FE2E9261
SYMSRV:  PATH: c:\symbols\wntdll.pdb\6771C2E71C152DBA302EC8C50FE2E9261\wntdll.pdb
SYMSRV:  RESULT: 0x00000000
DBGHELP: ntdll_77310000 - public symbols  
        c:\symbols\wntdll.pdb\6771C2E71C152DBA302EC8C50FE2E9261\wntdll.pdb
-----------------------------------------
Critical section   = 0x774333f8 (ntdll_77310000!LdrpLoaderLock+0x0)
DebugInfo          = 0x7743377c
NOT LOCKED
LockSemaphore      = 0x0
SpinCount          = 0x04000000
lkd:x86> !cs 0x77435b40
-----------------------------------------
Critical section   = 0x77435b40 (ntdll_77310000!FastPebLock+0x0)
DebugInfo          = 0xffffffff
NOT LOCKED
LockSemaphore      = 0x0
SpinCount          = 0x020007d0

From the 64-bit side it looks like this (also neither lock held):

lkd> dt nt!_PEB 000000000028c000
   +0x000 InheritedAddressSpace : 0 ''
   +0x001 ReadImageFileExecOptions : 0 ''
   +0x002 BeingDebugged    : 0 ''
   +0x003 BitField         : 0 ''
   +0x003 ImageUsesLargePages : 0y0
   +0x003 IsProtectedProcess : 0y0
   +0x003 IsImageDynamicallyRelocated : 0y0
   +0x003 SkipPatchingUser32Forwarders : 0y0
   +0x003 IsPackagedProcess : 0y0
   +0x003 IsAppContainer   : 0y0
   +0x003 IsProtectedProcessLight : 0y0
   +0x003 IsLongPathAwareProcess : 0y0
   +0x004 Padding0         : [4]  ""
   +0x008 Mutant           : 0xffffffff`ffffffff Void
   +0x010 ImageBaseAddress : 0x00000000`00400000 Void
   +0x018 Ldr              : 0x00007ffe`969dc4c0 _PEB_LDR_DATA
   +0x020 ProcessParameters : 0x00000000`007b29c0 _RTL_USER_PROCESS_PARAMETERS
   +0x028 SubSystemData    : (null) 
   +0x030 ProcessHeap      : 0x00000000`007b0000 Void
   +0x038 FastPebLock      : 0x00007ffe`969dc0e0 _RTL_CRITICAL_SECTION
   +0x040 AtlThunkSListPtr : (null) 
   +0x048 IFEOKey          : (null) 
   +0x050 CrossProcessFlags : 0
   +0x050 ProcessInJob     : 0y0
   +0x050 ProcessInitializing : 0y0
   +0x050 ProcessUsingVEH  : 0y0
   +0x050 ProcessUsingVCH  : 0y0
   +0x050 ProcessUsingFTH  : 0y0
   +0x050 ProcessPreviouslyThrottled : 0y0
   +0x050 ProcessCurrentlyThrottled : 0y0
   +0x050 ProcessImagesHotPatched : 0y0
   +0x050 ReservedBits0    : 0y000000000000000000000000 (0)
   +0x054 Padding1         : [4]  ""
   +0x058 KernelCallbackTable : 0x00007ffe`94b4e150 Void
   +0x058 UserSharedInfoPtr : 0x00007ffe`94b4e150 Void
   +0x060 SystemReserved   : 0
   +0x064 AtlThunkSListPtr32 : 0
   +0x068 ApiSetMap        : 0x00000000`00040000 Void
   +0x070 TlsExpansionCounter : 0
   +0x074 Padding2         : [4]  ""
   +0x078 TlsBitmap        : 0x00007ffe`969dc440 Void
   +0x080 TlsBitmapBits    : [2] 0x7ffff
   +0x088 ReadOnlySharedMemoryBase : 0x00000000`7fe50000 Void
   +0x090 SharedData       : (null) 
   +0x098 ReadOnlyStaticServerData : 0x00000000`7fe50750  -> (null) 
   +0x0a0 AnsiCodePageData : 0x00000000`7ffb0000 Void
   +0x0a8 OemCodePageData  : 0x00000000`7ffc0228 Void
   +0x0b0 UnicodeCaseTableData : 0x00000000`7ffd0650 Void
   +0x0b8 NumberOfProcessors : 0x10
   +0x0bc NtGlobalFlag     : 0
   +0x0c0 CriticalSectionTimeout : _LARGE_INTEGER 0xffffe86d`079b8000
   +0x0c8 HeapSegmentReserve : 0x100000
   +0x0d0 HeapSegmentCommit : 0x2000
   +0x0d8 HeapDeCommitTotalFreeThreshold : 0x10000
   +0x0e0 HeapDeCommitFreeBlockThreshold : 0x1000
   +0x0e8 NumberOfHeaps    : 2
   +0x0ec MaximumNumberOfHeaps : 0x10
   +0x0f0 ProcessHeaps     : 0x00007ffe`969dad40  -> 0x00000000`007b0000 Void
   +0x0f8 GdiSharedHandleTable : 0x00000000`01300000 Void
   +0x100 ProcessStarterHelper : (null) 
   +0x108 GdiDCAttributeList : 0x14
   +0x10c Padding3         : [4]  ""
   +0x110 LoaderLock       : 0x00007ffe`969d65c8 _RTL_CRITICAL_SECTION
   +0x118 OSMajorVersion   : 0xa
   +0x11c OSMinorVersion   : 0
   +0x120 OSBuildNumber    : 0x4a65
   +0x122 OSCSDVersion     : 0
   +0x124 OSPlatformId     : 2
   +0x128 ImageSubsystem   : 3
   +0x12c ImageSubsystemMajorVersion : 4
   +0x130 ImageSubsystemMinorVersion : 0
   +0x134 Padding4         : [4]  ""
   +0x138 ActiveProcessAffinityMask : 0xffff
   +0x140 GdiHandleBuffer  : [60] 0
   +0x230 PostProcessInitRoutine : (null) 
   +0x238 TlsExpansionBitmap : 0x00007ffe`969dc420 Void
   +0x240 TlsExpansionBitmapBits : [32] 1
   +0x2c0 SessionId        : 1
   +0x2c4 Padding5         : [4]  ""
   +0x2c8 AppCompatFlags   : _ULARGE_INTEGER 0x0
   +0x2d0 AppCompatFlagsUser : _ULARGE_INTEGER 0x0
   +0x2d8 pShimData        : 0x00000000`000c0000 Void
   +0x2e0 AppCompatInfo    : (null) 
   +0x2e8 CSDVersion       : _UNICODE_STRING ""
   +0x2f8 ActivationContextData : 0x00000000`000b0000 _ACTIVATION_CONTEXT_DATA
   +0x300 ProcessAssemblyStorageMap : (null) 
   +0x308 SystemDefaultActivationContextData : 0x00000000`000a0000 _ACTIVATION_CONTEXT_DATA
   +0x310 SystemAssemblyStorageMap : (null) 
   +0x318 MinimumStackCommit : 0
   +0x320 SparePointers    : [4] (null) 
   +0x340 SpareUlongs      : [5] 0
   +0x358 WerRegistrationData : (null) 
   +0x360 WerShipAssertPtr : (null) 
   +0x368 pUnused          : (null) 
   +0x370 pImageHeaderHash : (null) 
   +0x378 TracingFlags     : 0
   +0x378 HeapTracingEnabled : 0y0
   +0x378 CritSecTracingEnabled : 0y0
   +0x378 LibLoaderTracingEnabled : 0y0
   +0x378 SpareTracingBits : 0y00000000000000000000000000000 (0)
   +0x37c Padding6         : [4]  ""
   +0x380 CsrServerReadOnlySharedMemoryBase : 0x00007df4`7aae0000
   +0x388 TppWorkerpListLock : 0
   +0x390 TppWorkerpList   : _LIST_ENTRY [ 0x00000000`0028c390 - 0x00000000`0028c390 ]
   +0x3a0 WaitOnAddressHashTable : [128] (null) 
   +0x7a0 TelemetryCoverageHeader : (null) 
   +0x7a8 CloudFileFlags   : 0
   +0x7ac CloudFileDiagFlags : 0
   +0x7b0 PlaceholderCompatibilityMode : 0 ''
   +0x7b1 PlaceholderCompatibilityModeReserved : [7]  ""
   +0x7b8 LeapSecondData   : 0x00000000`7ffa0000 _LEAP_SECOND_DATA
   +0x7c0 LeapSecondFlags  : 0
   +0x7c0 SixtySecondEnabled : 0y0
   +0x7c0 Reserved         : 0y0000000000000000000000000000000 (0)
   +0x7c4 NtGlobalFlag2    : 0
lkd> !cs 0x00007ffe`969dc0e0
-----------------------------------------
Critical section   = 0x00007ffe969dc0e0 (ntdll!FastPebLock+0x0)
DebugInfo          = 0xffffffffffffffff
NOT LOCKED
LockSemaphore      = 0x0
SpinCount          = 0x00000000020007d0
lkd> !cs 0x00007ffe`969d65c8
-----------------------------------------
Critical section   = 0x00007ffe969d65c8 (ntdll!LdrpLoaderLock+0x0)
DebugInfo          = 0x00007ffe969d6a48
NOT LOCKED
LockSemaphore      = 0x0
SpinCount          = 0x0000000004000000

So at this point I am a bit puzzled. I'll still sift through the respective GnuPG code to see if I can spot anything.